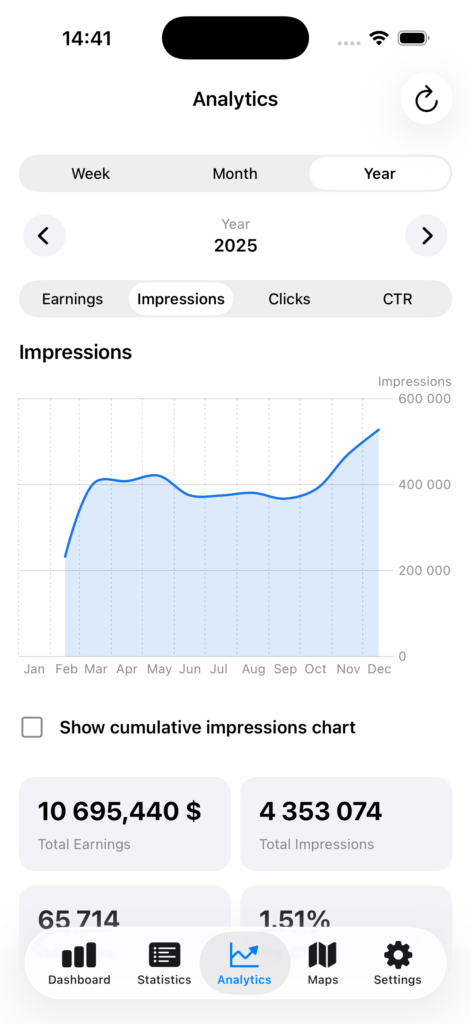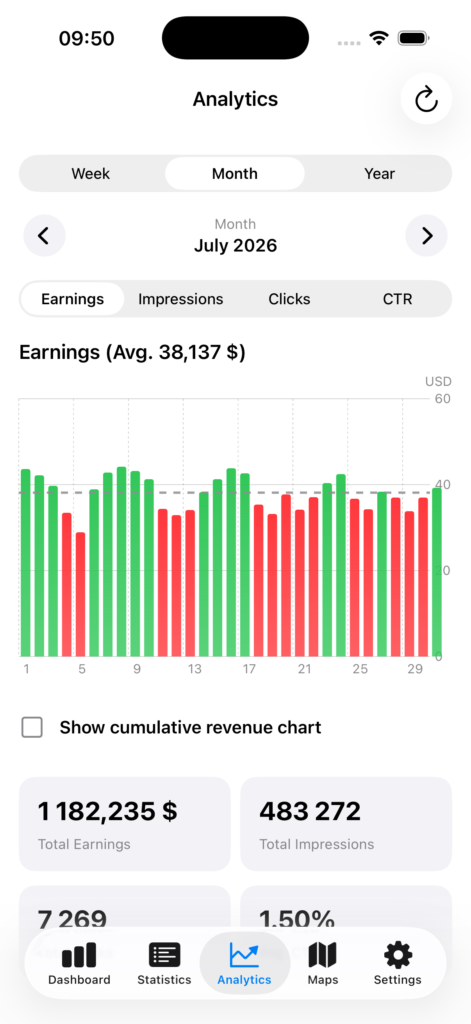
The Analytics view provides deep insights into your app’s monetization performance with intuitive visualizations and metrics.
Flexible Time Periods: Analyze data by day, week, month, or year with easy navigation between periods
Multiple Metrics: Track earnings, impressions, clicks, and CTR (Click-Through Rate)
Interactive Charts: Visual bar charts with color-coded performance (above/below average for earnings)
Cumulative Analysis: Optional cumulative revenue and impressions charts to track growth over time
Smart Calendar Picker: Quickly jump to any specific date, week, month, or year
Performance Averages: Automatic calculation and visualization of average earnings with comparison indicators
Summary Cards: At-a-glance totals for earnings, impressions, clicks, and average CTR
Perfect for: Publishers who want to understand their revenue patterns, identify high-performing periods, and make data-driven decisions about their monetization strategy.