The Statistics view offers comprehensive breakdowns of your monetization data with powerful filtering and export capabilities
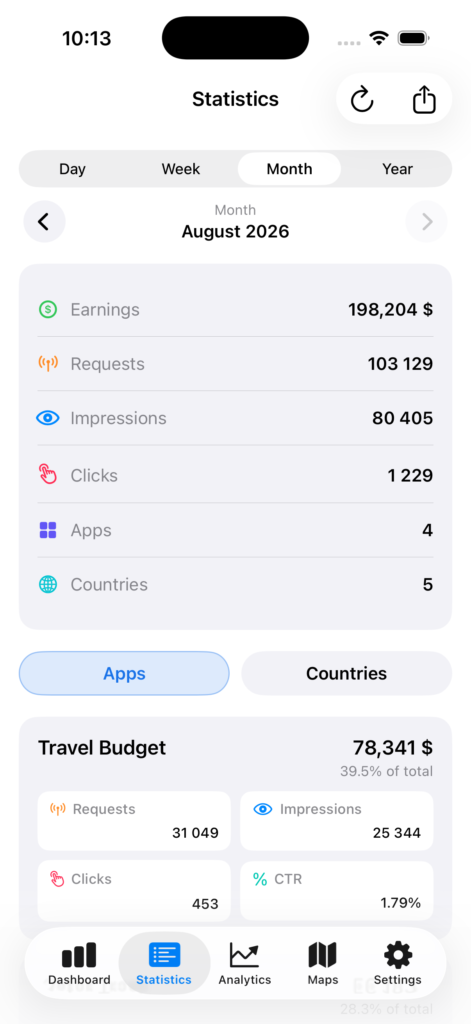
Flexible Time Periods: View data by day, week, month, or year with intuitive navigation
Comprehensive Overview: At-a-glance totals for earnings, ad requests, impressions, clicks, and active apps/countries
Multi-dimensional Breakdown:
– By App: See which apps generate the most revenue
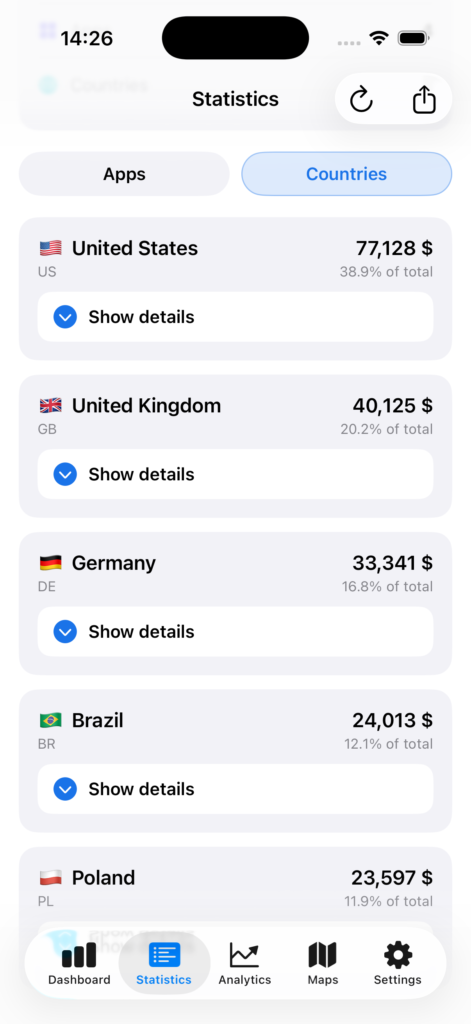
– By Country: Analyze geographic performance with country flags
– By Month: Track monthly trends (available in yearly view)
Detailed Metrics: Each breakdown shows:
– Total earnings with percentage share
– Ad requests and impressions
– Clicks and CTR (Click-Through Rate)
– Expandable detailed view
Smart Calendar Picker: Jump to any specific date, week, month, or year instantly
Export Capabilities: Export your statistics in multiple formats (CSV, JSON, Text) for further analysis
Perfect for: Publishers who need detailed insights into which apps and regions drive revenue, want to track performance across different time periods, and need to export data for external analysis or reporting.