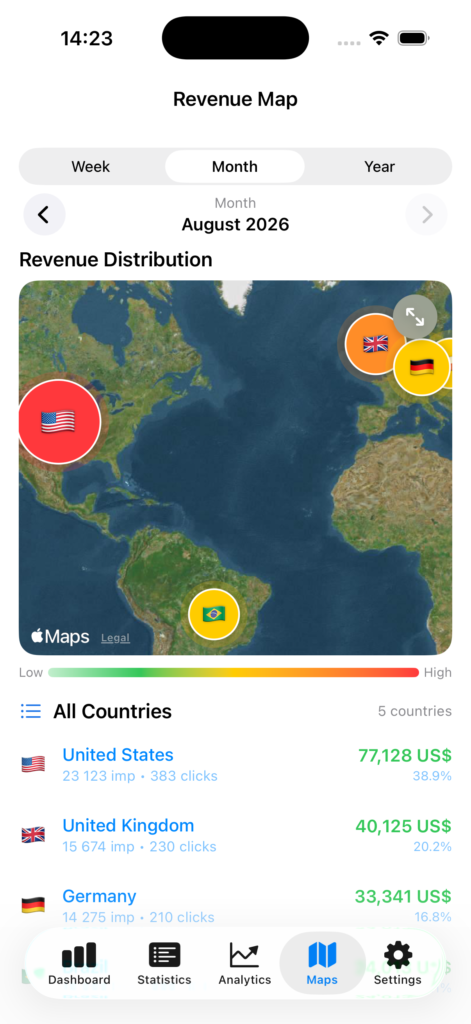
Visualize your global AdMob revenue on an interactive world map. See which countries generate the most earnings with color-coded bubbles and detailed country analytics.
Interactive World Map: Beautiful satellite imagery with color-coded revenue bubbles for each country.
Dynamic Intensity Visualization:
– Bubble size reflects revenue amount
– Color gradient from green (low) to red (high) shows performance intensity
– Pulsating animations highlight active markets
– Country flags for easy identification
Flexible Time Periods: View geographic data by day, week, month, or year with smart navigation.
Full-Screen Mode: Expand the map to full screen for detailed exploration with enhanced bubble sizes.
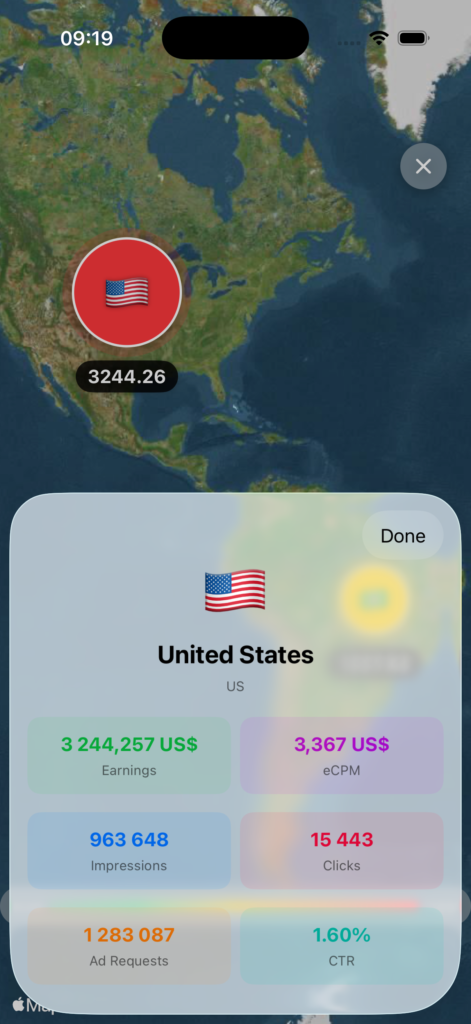
Detailed Country Metrics: Tap any country to see:
– Total earnings and eCPM
– Impressions and clicks
– Ad requests and CTR
– Country flag, name, and code
Complete Country List: Scrollable list below the map showing:
– All active countries sorted by performance
– Quick access to detailed metrics